
The EDI Dashboard provides a centralized view of EDI transaction activity, partner performance, failures, acknowledgments, retries, and certificate status.
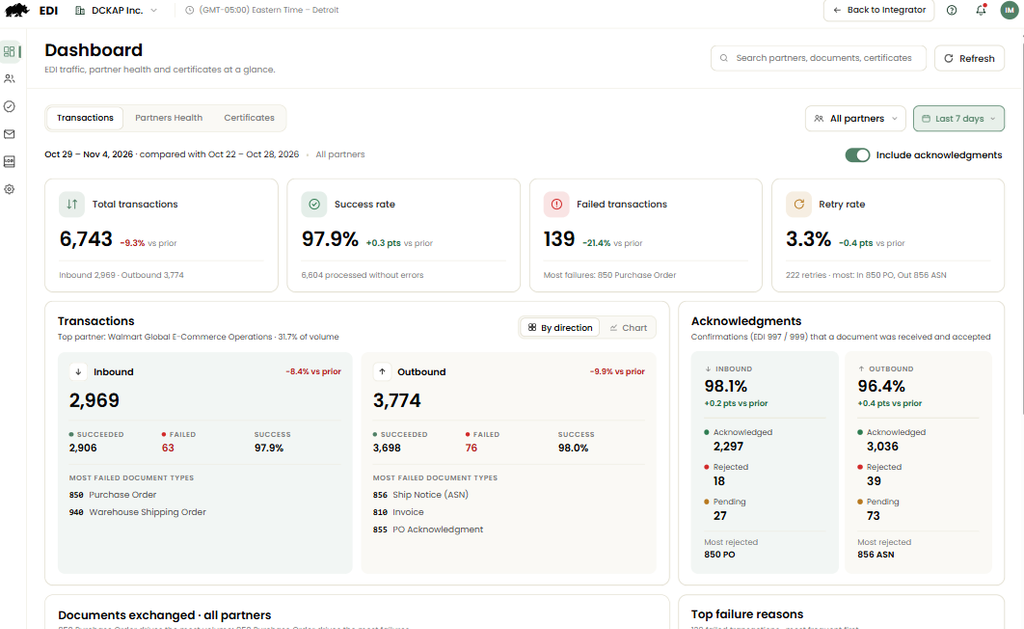
Instead of reviewing individual transaction records or contacting support to understand EDI activity, users can use the dashboard to monitor operational health, identify issues, and investigate partner performance from a single location.
The dashboard helps answer common questions such as:
- Is EDI processing working as expected?
- Which trading partners are performing well?
- Which partners require attention?
- What are the most common transaction failures?
- Are any partner certificates approaching expiration?
Note: The dashboard is read-only. Existing transaction and message record views remain unchanged.
Getting Started
Dashboard Filters
Use the filters at the top of the dashboard to focus on the transaction activity you want to review.
Partner Selector
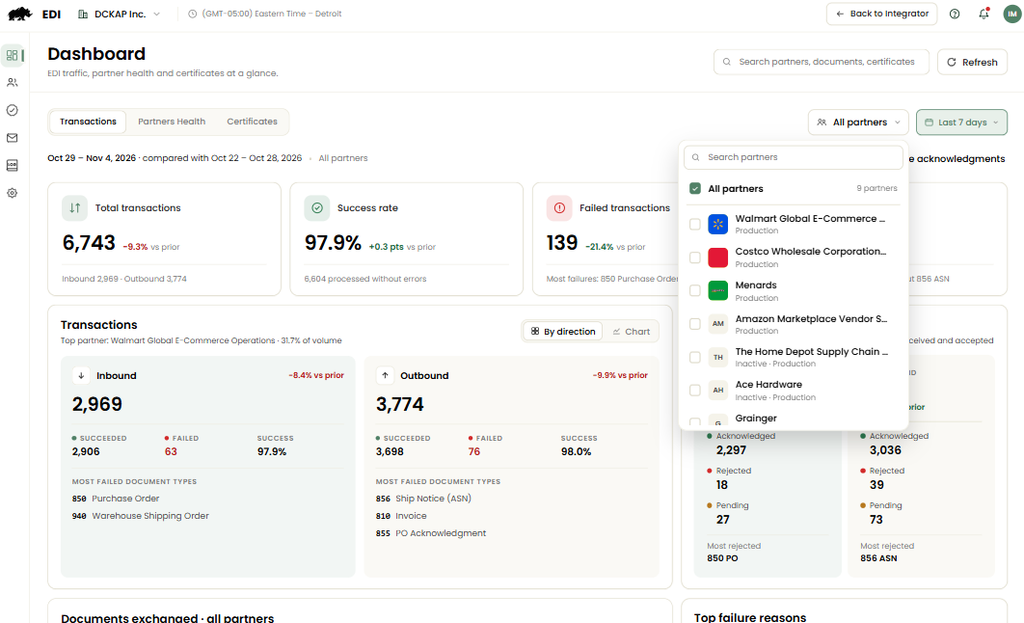
The partner selector lets you view activity across all trading partners or focus on selected partners.
You can:
- Select all partners to view company-wide activity.
- Select one partner to view its activity.
- Select multiple partners to compare their activity.
The dashboard metrics, charts, and lists update based on the selected partners.
By default, the dashboard displays data for all partners.
Date Range
Use the date range selector to choose the period you want to review.
You can select a standard date range or set a custom range.
- The default date range is Last 7 Days.
- You can select a custom date range.
- The dashboard compares the selected period with the equivalent previous period.
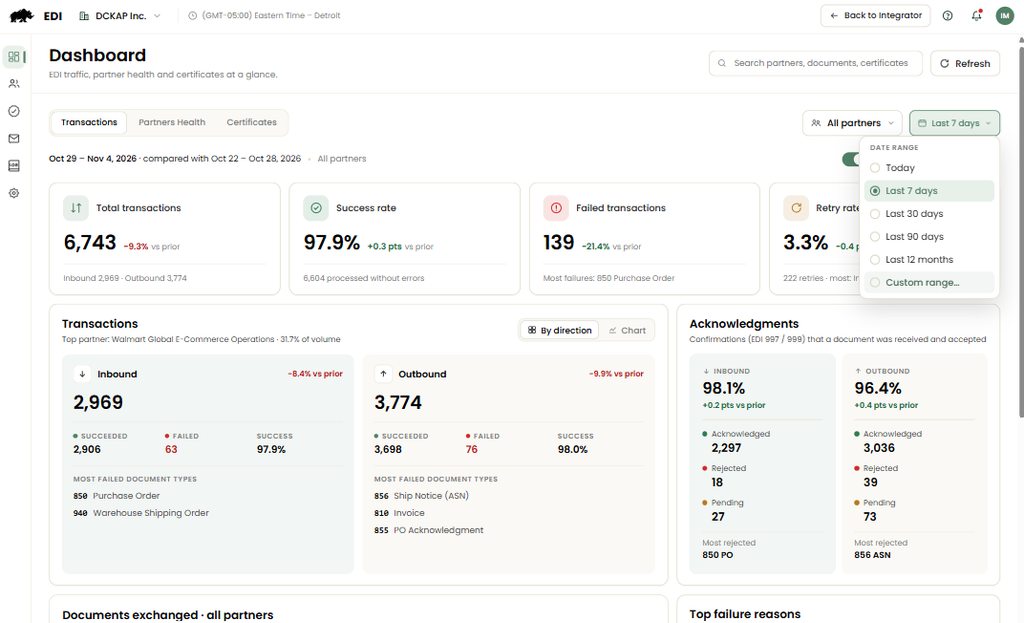
The comparison helps you understand how transaction activity and performance have changed over time.
Acknowledgments Toggle
Use the Acknowledgments toggle to exclude acknowledgment traffic from volume-based statistics when you want to focus on business-document transactions.
For example, you can exclude acknowledgment traffic when reviewing overall transaction volume.
The toggle does not change:
- The Acknowledgment metric.
- Sections specifically related to acknowledgment status.
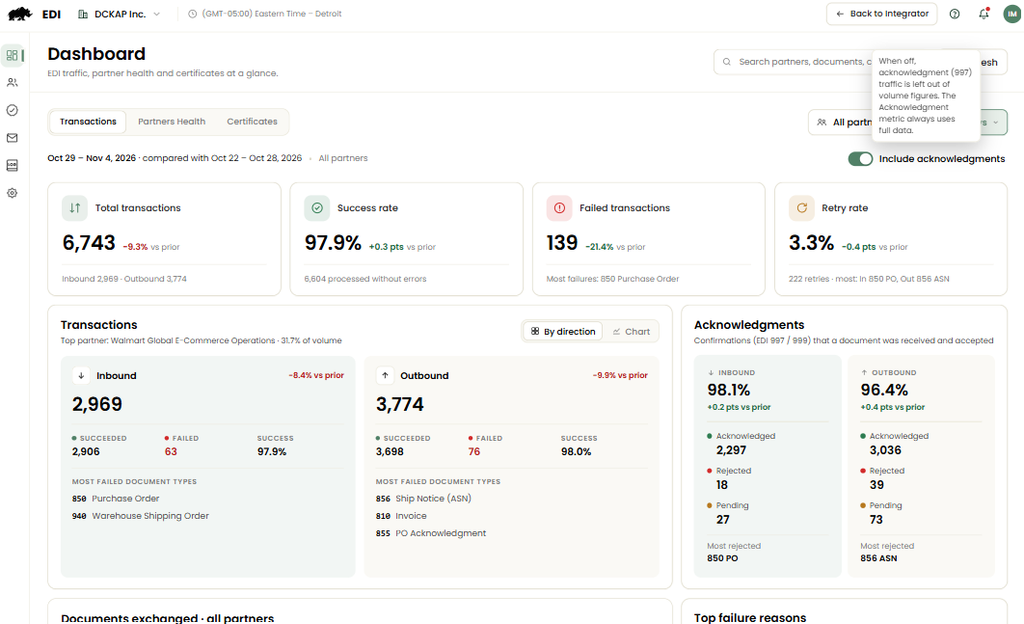
These continue to show the full acknowledgment data.
Your partner selection, date range, and acknowledgment preference remain in place as you move between sections of the same dashboard.
Key Metrics
The Key Metrics section provides a summary of your company’s EDI activity.
It includes the following metrics:
| Metric | What it shows |
| Total Transactions | Total transaction volume and the partner with the highest transaction volume. |
| Inbound | Incoming transaction volume and the most-received document type. |
| Outbound | Outgoing transaction volume and the most-sent document type. |
| Acknowledgment | Counts of acknowledged, rejected, and pending acknowledgments. |
| Retry Rate | The retry rate for transactions during the selected period. |
Each metric displays a value and a percentage where applicable, along with a trend and a comparison against the previous period.
Use these metrics to get a quick understanding of transaction activity and areas that may need attention.
Transaction Volume
The Transaction Volume chart shows how successful and failed transactions change over time.
You can switch between three views:
- All: View inbound and outbound transaction activity together.
- Inbound: View incoming transaction activity.
- Outbound: View outgoing transaction activity.
The chart plots successful and failed transactions on the same scale.
You can also:
- Isolate the success or failure line to focus on one type of transaction.
- Hover over the chart to view exact transaction values.
Use this chart to identify changes in transaction volume and periods when transaction failures increase.
Document Type Breakdown
The Document Type Breakdown shows transaction volume across different document types.
You can sort the breakdown to review the document types and their transaction activity.
The section also highlights the document type with the most failures.
Use this information to identify which document types contribute the most to transaction volume and which ones may need further investigation.
Top Failure Reasons
The Top Failure Reasons section displays transaction failure causes in order of frequency, from the most frequent to the least frequent.
Review this section to identify recurring failure reasons and understand which issues occur most often.
You can use these insights to decide which transaction failures need further investigation.
Partner Performance
The dashboard provides two ways to review trading partner performance: Partners Health and the Partner Scorecard.
Partners Health
The Partners Health section compares transaction activity across your trading partners.
It displays successful and failed transactions for each partner.
You can:
- Sort partners by volume.
- Isolate successful or failed transactions.
Use this view to compare partner transaction volumes and identify partners with higher failure activity.
Partner Scorecard
The Partner Scorecard provides a summary of each trading partner’s performance.
It includes the following information:
| Field | What it shows |
| Partner | Trading partner name. |
| Volume | Transaction volume for the selected period. |
| Success Rate | Percentage of successful transactions. |
| Acknowledgment Rate | Acknowledgment rate for the partner. |
| Backlog | Backlog value displayed for the partner. |
| Last Activity | The partner’s last recorded activity. |
| Health | Health information for the partner. |
Use the scorecard to compare partners and identify those that may need attention.
Certificates
The Certificates section provides a list of your trading partner certificates.
For each certificate, you can review:
- Certificate status.
- Expiration date.
The list is sorted by expiration date, with the soonest-expiring certificates displayed first.
Use this section to identify certificates that need to be reviewed or renewed.
Reviewing upcoming expiration dates can help you plan certificate renewals and reduce the risk of certificate-related disruptions.
Glossary
| Term | Definition |
| Acknowledgment | Confirmation that an EDI document has been received and processed. |
| Certificate | A security credential used to establish trusted communication between trading partners. |
| Company Dashboard | A dashboard that provides visibility into a single company’s EDI activity, partner performance, failures, acknowledgments, retries, and certificate status. |
| Connection ID | A unique identifier used to represent a specific partner connection. |
| Inbound Transaction | A document received from a trading partner. |
| Outbound Transaction | A document sent to a trading partner. |
| Partner | A trading partner that exchanges EDI documents with a company. |
| Partner Detail | A detailed view of a selected partner, including connection information, certificate status, supported document types, and partner-specific dashboard metrics. |
| Partner Scorecard | A summary view that displays partner status, transaction volume, success rate, acknowledgment rate, backlog, last activity, and overall health. |
| Retry Rate | The percentage of transactions that required one or more retry attempts during processing. |
| Transaction Volume | The total number of transactions processed during a selected reporting period. |
| Top Failure Reasons | A ranked list of the most common causes of transaction failures within the selected scope and date range. |
| Companies at Risk | Companies identified in the Admin Dashboard as requiring attention based on platform-defined risk indicators. |
| Date Range | The selected reporting period used to calculate and display dashboard metrics and trends. |
| Acknowledgments Toggle | A dashboard control that allows acknowledgment traffic to be excluded from volume-based reporting while preserving acknowledgment-specific metrics. |